Live data and logging
Data logging
Data-logging is a powerful feature of ProECU that can be used to obtain a highly detailed representation of engine operation.
It can display and record (log) a number of engine-running variables, and show up areas of calibration that have room for improvement. And, of course, it helps us immensely with troubleshooting and investigating specific problems.
How to log
With the Licence Key dongle already connected, execute the ProECU program then connect your PC to the engine ECU using your ProECU interface cable. You’ll know if you’ve successfully established communications if you get a green bar at the top of the ProECU window and the little indicator light on the interface plug illuminates.
Fire-up the engine and on the PC screen select File, Open ROM. Browse the menu to find the ROM you flashed to the ECU, and open it.
A particularly handy feature of the program is that it supports drag and drop, so if the ROM is, say, on your desktop, all you need do is drag it onto the toolbar of ProECU.
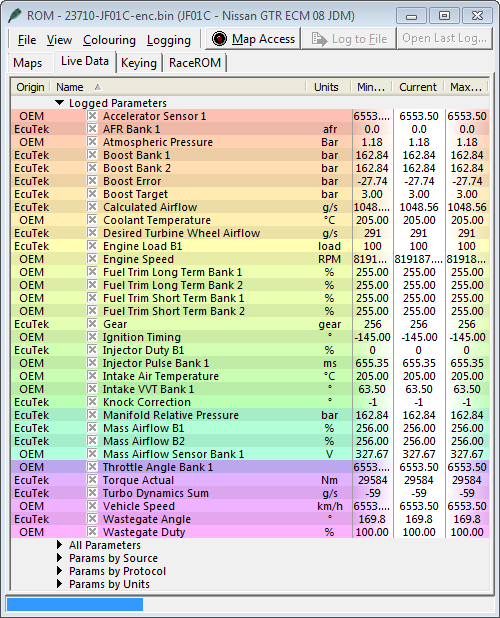
Looking at the contents of the ROM file (below), you will see a lengthy list of variables that can be logged, each one selectable via its own checkbox; obviously choose only those that are relevant to the task in hand, to keep things simple.
It’s a good idea on your first data-logging session to configure your Live Data window; you’ll want to set up a few things in the window so you can set your preferences as the default.
We recommend that you opt to display the minimum and maximum value columns for each parameter (Live Data &rarr Name, Units, Current) so that you have an idea of their range. Once you’ve selected your preferences, click View, then Save Rom Editor Layout as Default to keep the configuration.
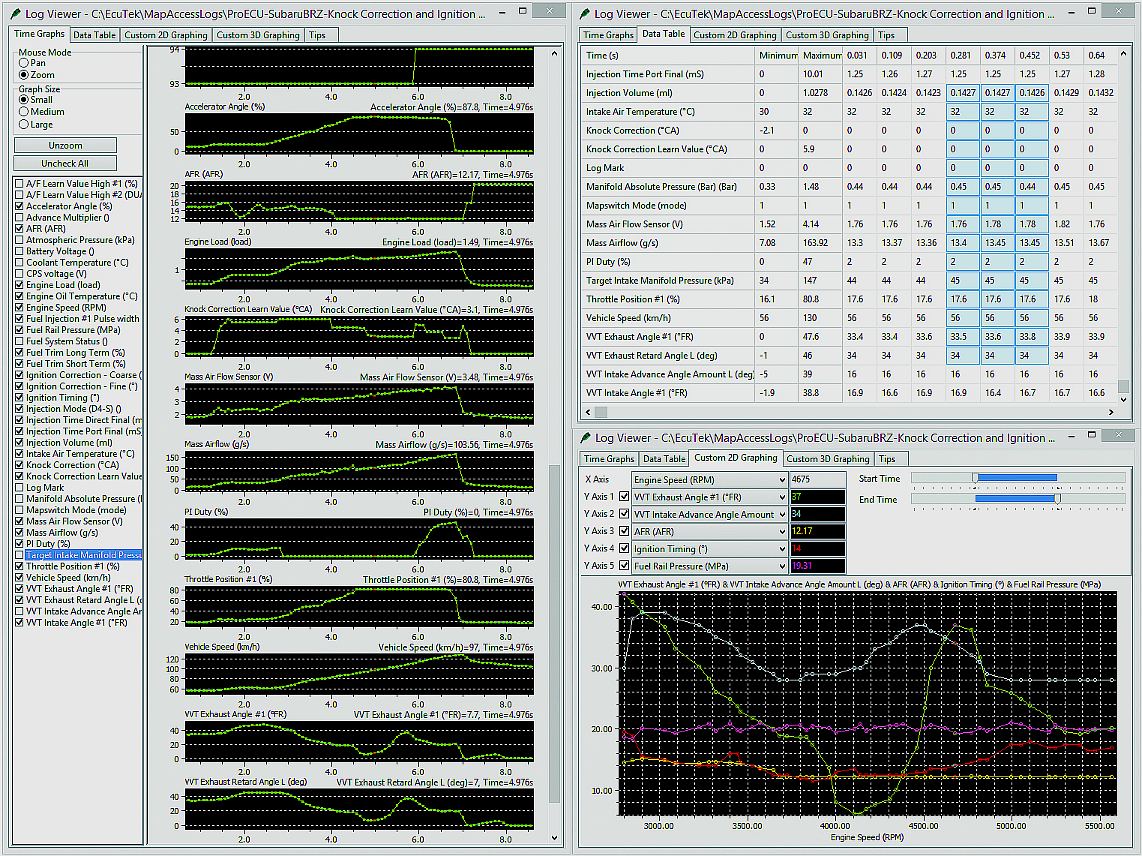
Now click on Map Access (top centre, above) to start the Live Data flow; the button will become highlighted and a new green status bar will appear above the list of variables, confirming an active connection and that data is streaming from the ECU; you’ll also be viewing real-time data changes in the categories you checked.
When the status bar bears a red rectangle it means nothing is currently being logged; to commence logging click on Log To File and you’ll see the red rectangle change green. You simply click the button a second time to stop the logging.
This will produce and save a time-stamped log file to the default logging folder, which can be found at C:\EcuTek\MapAccessLogs. For convenience, the full path and filename are revealed when you position the mouse cursor over the Log To File button.
Comments
0 comments
Please sign in to leave a comment.